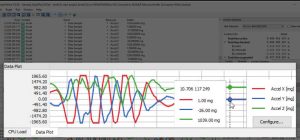
Called DataPlot, its graphs are synchronised with SystemView’s Timeline and CPU Load windows.
Data can be sent in fixed point or floating-point formats and multiple variables can be recorded – each identifiable by a descriptive name and a different color line.
Graphs can be scaled and shifted to ease viewing.
As an example, said the company: “a system which monitors its power consumption can record the measured samples with SystemView. With visualisation in the DataPlot window, developers can identify spikes in current synchronised to the task or event that triggered it.”
SystemView supports data streamed at 250kHz or more from from the company’s J-Link hardware. It is “particularly effective when developing embedded systems comprised of multiple threads and interrupts”, said the company.
 Electronics Weekly Electronics Design & Components Tech News


