 As cloud technology has become more prevalent, simulation using 3D models and numerical methods has advanced. Simulation software is used to model and analyse 3D CAD models of electronic devices and components by performing physics-based analyses such as computational fluid dynamics and finite element analysis.
Thermal computations of conduction, convection and radiation are crucial for understanding how these heat transfer mechanisms can be used for effective cooling techniques, resulting in the selection, sizing and placement of heatsinks, fans and appropriate materials. Cloud computing has enabled engineers to communicate in real-time, access advanced simulation capabilities earlier in the design process, eliminate expensive physical prototyping and avoid expensive hardware costs.
Advantages of cloud-native simulation for electronics devices include 3D parametric scenario studies, in which engineers can produce multiple CAD variants of a design and analyse them simultaneously, without any time or computational resource constraints. The capacity to thoroughly explore a design space and eliminate poor design choices earlier in the development process is an added value. Importing CAD data and numerically discretising (meshing) a model have been frequent simulation obstacles; both are time-consuming and need specialised assistance.
Immersed boundary meshing is founded on a cartesian grid, into which the geometry is placed (immersed). Therefore, it is resilient to geometrical features and does not necessitate CAD simplification for even the most intricate models. The almost limitless computing power and scalability of the cloud mean distributing simulation capabilities across a full organisation of geographically dispersed engineers is becoming a competitive advantage.
Cooling performance
Cloud-native engineering simulation enables engineers to test, validate and optimise designs using a standard web browser. They can perform cooling, heat and fluid flow analysis of electronic devices, PCBs, electronics systems and enclosures, along with structural and mechanical assessment using a single CAD model, all in one simulation platform.
 High power density devices and enclosures require forced convection cooling to dissipate heat. Fans may be needed when natural ventilation is inadequate. The cooling performance of a fan depends on variables that must be accurately modelled and analysed by creating a digital model of the electronics enclosure.
The fans can be modelled in more than one way. A fan inlet boundary condition can have a direct mass flow applied as a velocity inlet condition with appropriate fluid characteristics and ambient conditions. Alternatively, a momentum source can represent fan flow for internal fans, and engineers can upload manufacturer fan-curve data directly into the software.
Useful outputs include the fan inlet flow rate and pressure drop, chip and enclosure temperatures, surface temperatures and heat removal. The resolution is detailed enough to visualise and extract data at the system, board and chip level.
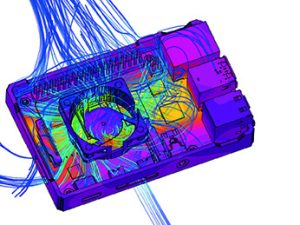
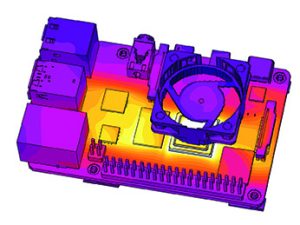
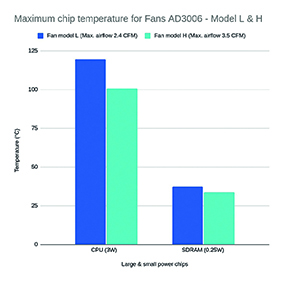
Figure 1 shows an example using a Raspberry Pi with a commonly available CAD model imported and set up with the relevant materials, boundary conditions and heat generation from the chips – the CPU being the largest. Two fans are being compared for thermal performance. The larger model H fan (ADDA AD3006) removes more heat from chips than its smaller counterpart, giving a lower maximum chip temperature. Using the same model, it is possible to simulate many different fan flow rates to generate a system resistance curve, alter material properties, heat sink designs and chip heat signatures. It is also possible to run hundreds of design variations in parallel using the cloud.
A flow rate study allows the engineer to derive the system resistance curve, which describes the trade-off between the achievable flow rate to cool down the system and the adjusting pressure drop that needs to be handled by the fan. Simulation therefore helps both in selecting the best fan for a given design as well as optimising the design in order to reduce the pressure drop in the system and reach optimal operating conditions.
To establish fan boundary conditions, users can specify a fan inlet or fan outlet as a boundary condition to model fans that are placed at the edge/outside of the enclosure domain (see Figure 1).
To identify the fan momentum source, embedded, internal fans can be modelled. By testing a variety of fans (fan curves) or by running a parametrised flow rate study, engineers can derive the system resistance curve.
Structural analysis
Using simulation, engineers can digitally perform static, dynamic and thermomechanical analysis. With these capabilities one can replicate shaker table vibration and shock tests, which are standard requirements for the certification of a large range of electronics products.
 Before lithium cells/batteries, for example, can be transported, they must pass a series of physical tests. These tests imitate stresses and long-distance transportation conditions such as pressure, temperature, crush and impact. According to the UN 38.3 T3 requirements, a battery module should show no leakage, venting, rupture or fire under a sinusoidal vibration test spanning from 7-200Hz. Tests are to be performed in all X, Y and Z directions under the following conditions:
* 7-18Hz: 1G acceleration applied
* 18-50Hz: Peak acceleration gradually raised to 8G at 50Hz
* 50-200Hz: Peak acceleration maintained at 8G until 200Hz.
Simulation can evaluate whether or not there are resonance modes for the battery and other electronic components within the test frequency range (7-200Hz). If such modes exist, it would be interesting to see the response of a device under the required loading conditions (that is, acceleration from 1G to 8G). This would help identify whether or not there is a risk of resonant behaviour and if there is, where the peak stresses and deformations occur (Figure 3).
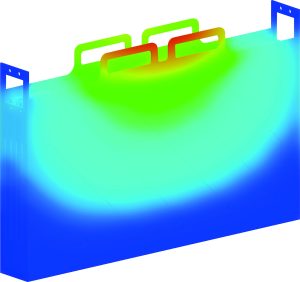 For example, Figure 4 shows an automotive battery with a force of 4200N applied normally and parallel to the faces of the container. Structural analysis shows regions of critical von Mises and Cauchy stresses. Scaled displacement magnitudes show physical deformations that may have received direct impact.
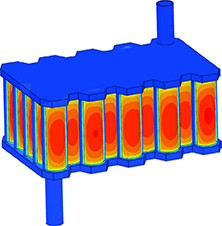
Thermal simulations of a liquid-cooled battery pack with 41 cells, each with 5W per cell using conjugate heat transfer are shown in Figure 5. A water-glycol solution is used as the coolant and the internal flow is set to 0.2m/s at 18℃. The outlet is a pressure boundary condition. Results show the temperature distribution in/around the cells giving insight on peak temperature, temperature distribution of the cells and pressure drop across the battery channels. An engineer can predict if battery cell temperatures are within the desired operating range and fulfil the temperature uniformity requirements, for example, keeping the maximum temperature difference within 5K.
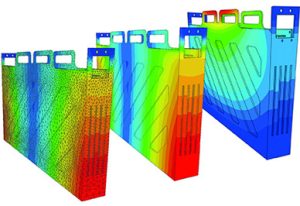
 This type of analysis is fast and suited to early-stage design where many important decisions such as materials, cooling strategies, cooling plate designs are being decided.
 Electronics Weekly Electronics Design & Components Tech News
